CN
Welcome to hqshuke Group!
Welcome!
Login/Register
Learn about hqshuke
Core Products!
"3+X" business layout: Smart Culture & Tourism | Smart City | Smart Ecology | More Industries
Learn about hqshuke
Core Products!
"3+X" business layout: Smart Culture & Tourism | Smart City | Smart Ecology | More Industries
Success Case
Learn about hqshuke
Core Products!
"3+X" business layout: Smart Culture & Tourism | Smart City | Smart Ecology | More Industries
SMART CULTURE & TOURISM
Benchmark projects
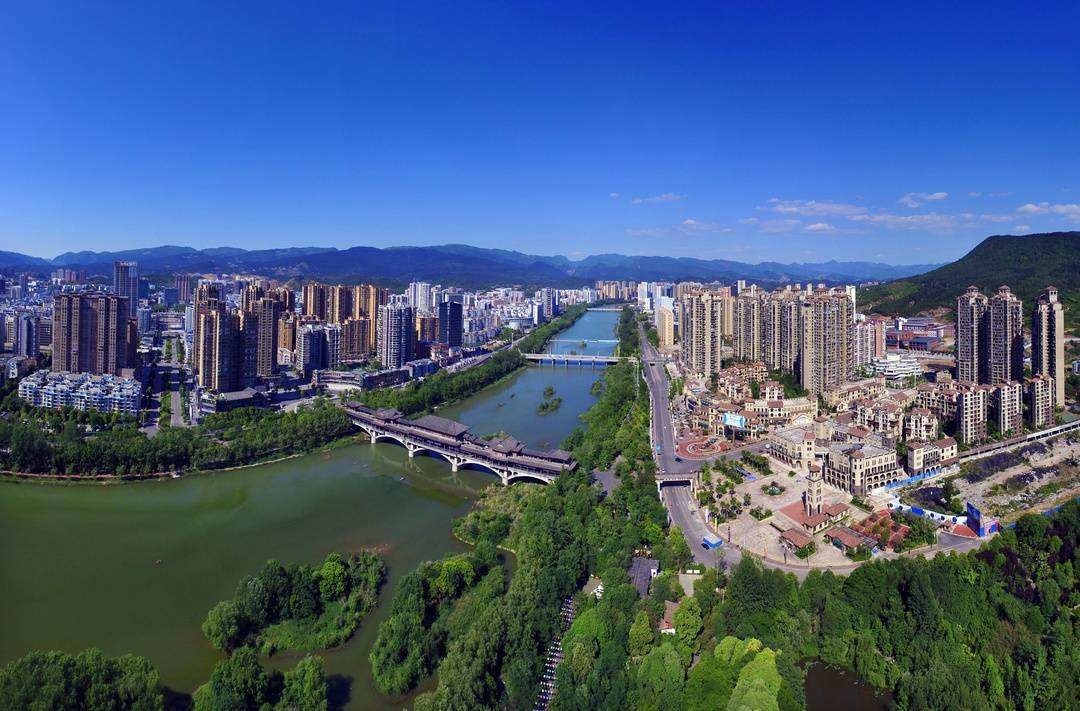
Sichuan Province丨Guang Yuan City
Guangyuan has rich tourism resources, with 1 AAAA scenic spot, 21 AAAA scenic spots, 18 AAA scenic spots and 9 AA scenic spots in the city (data as of the end of 2020). In 2016, the Company joined hands with the Guangyuan Municipal People's Government to fully open the construction of smart tourism, with the smart supervision platform, digital scenic spot platform and regional tourism destination operation platform completed and put into operation one after another, bringing a new look to Guangyuan tourism.
Enhancing digitalization and pulling the number of tourists: the digitalization of the whole industry chain of tourism in Guangyuan City has increased significantly, with the number of 4A-level scenic spots growing from 16 to 19; increasing to 21 in 2020; in 2018, the number of tourists received in Guangyuan City exceeded 50 million for the year. Improving industrial operation capacity and increasing tourism revenue in all aspects: Guangyuan's destination public service platform broke the traditional model of "development over operation" for destinations, continuously innovated the operation mode according to local conditions, and improved industrial operation capacity through the "Huimin Card" and other means. In 2019, the total revenue of Guangyuan's tourism industry will exceed 50 billion yuan, and the proportion of Guangyuan's total tourism revenue to GDP will exceed 50%. Revitalising the regional economy with tourism as a grip, the GDP growth rate was significantly higher than the national level: in 2018, the national GDP growth rate dropped from 6.9% to 6.7%, and Guangyuan City's GDP growth rate grew against the trend, from 8.1% to 8.4%.
Project Overview

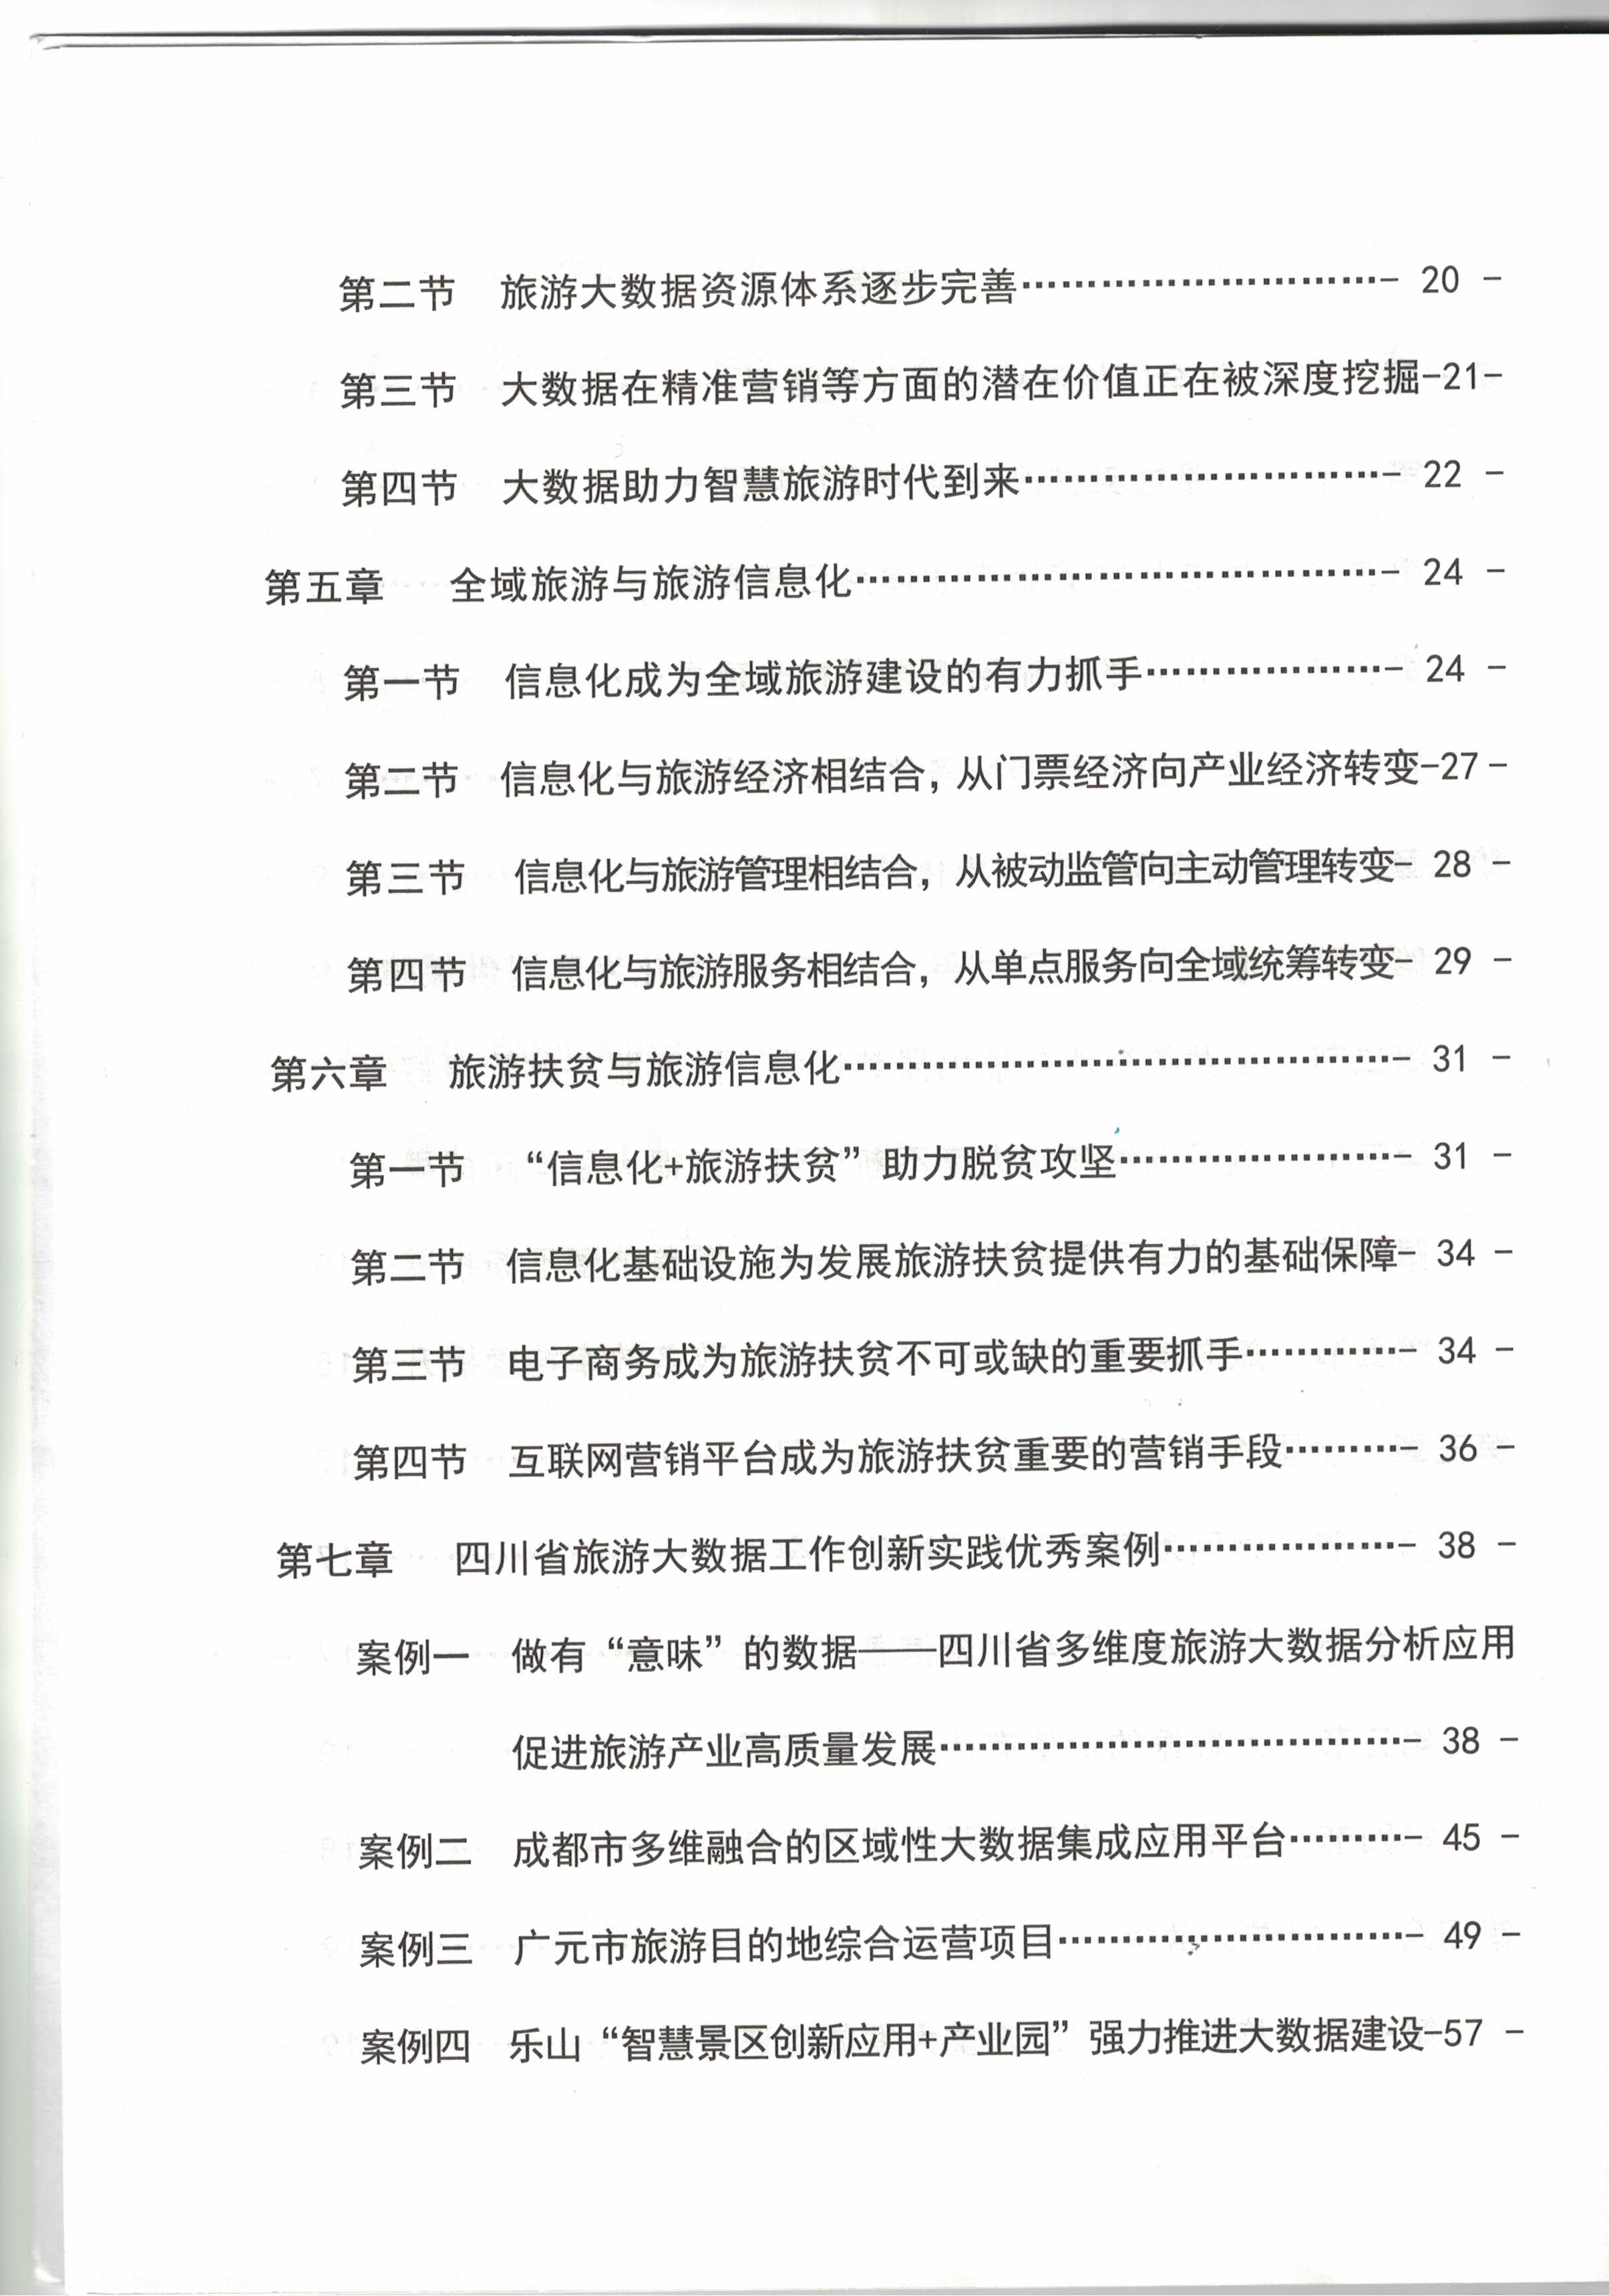
Guangyuan Destination Operation Project is the first domestic destination cloud service benchmark, and has won the award of "Excellent Case of Sichuan Big Data Innovation Practice in 2018" and "Typical Case of Sichuan Cultural Tourism Information Development in 2021".
2016

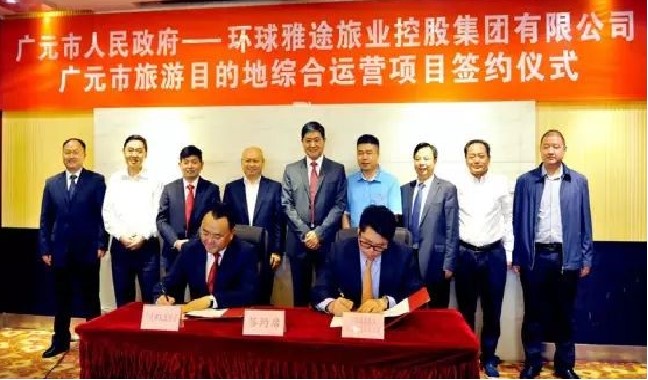
9.26 Signing
Guangyuan Municipal People's Government and the company (formerly known as Global Yatou Travel Holdings Group) held a signing ceremony for the "Guangyuan Tourism Destination Integrated Operation Project". The project consists of two online sub-projects: "Regional Tourism Destination Operation Platform" and "Tourism Industry Smart Supervision Platform", and two physical sub-projects: "Guangyuan Smart Tourism Complex " and "Guangyuan tourism three-tier distribution service system".
2017

Delivery of Phase 1 in March
On the basis of information technology, the first full-scene destination cloud service was launched. The first phase of the project was delivered and the intelligent supervision platform was put into operation. In 2017, the digitalisation of the whole industry chain of tourism in Guangyuan City increased significantly, with the number of 4A-level scenic spots growing from 16 to 19; to 21 in 2020.
2019

Phase 2 delivery in July
Phase 2 of the project completed delivery, with the digital scenic spot platform and regional tourism destination operation platform coming into operation. The industry SaaS products were continuously upgraded and iterated, becoming increasingly complete and mature, and the pace of replication accelerated, with an annual service volume of 50 million + visitors and an e-ticket transaction volume of approximately RMB 1 billion.
The Future

Continuous iteration
The "Smart Travel Chain" and "Smart Travel Cloud" drive the digitalisation process of destinations. On the basis of digitisation, blockchain, big data, AI algorithms and other technologies are integrated to deeply empower "smart tourism".
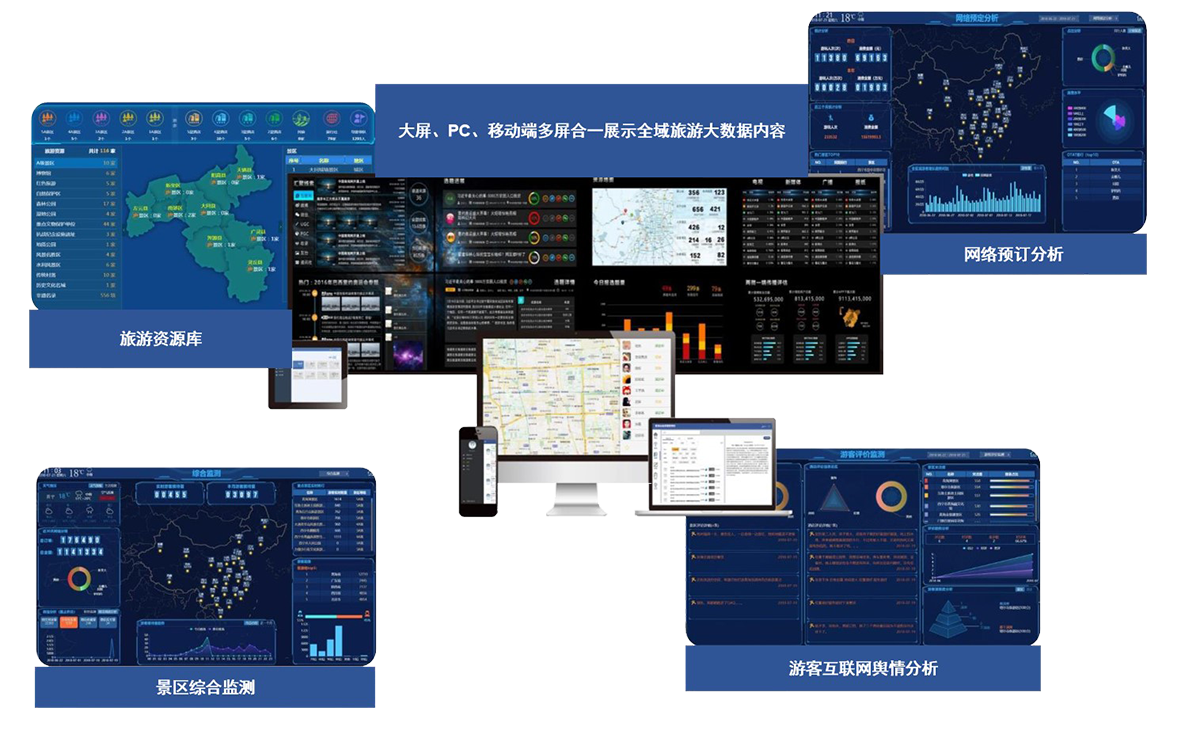
Tourism Resource Bank
One Map for Tourism and Culture
Tourism Economic Analysis
Tourism Resource Monitoring
Visitor Flow Analysis
Tourism Marketing Analysis
Tourism Supervision
Key Scenic Spot Monitoring
Web booking analysis
Source of visitor arrivals (monthly)
Visitor growth trends across the region (monthly)
Statistical analysis (daily/quarterly/yearly)
Visitor arrivals, spending amount
Popular scenic spots (current month)
Proportion of Internet Distribution Channels (current month)
Consumption level (current month)
Integrated landscape monitoring
Total number of people checking in for Internet ticketing at the scenic spot (current day/month)
Receiving tourists by source (monthly)
Ranking of real-time total number of visitors received in key scenic spots (current day)
Visitor profile Male/female ratio of ticket buyers, age level of ticket buyers (current month)
Visitor reception trends Hourly visitor flow analysis comparison (yesterday/today)
Internet distribution in the last 30 days
Number/value/percentage of orders from direct internet distribution channels
Visitor Internet Opinion Analysis
Landscape Satisfaction
Dining Satisfaction
Hotel Satisfaction
Overall Satisfaction

About hqshuke
Solutions
Contact
Address:No. 01-03, 17/F, Block B, Building 10, Shenzhen Bay Technology & Ecological Park
Tel:40088-11138 or (+86)755-88328999
Complaint:0755-88328980
E-mail:88328999@hqshuke.com
Copyright © Global Digital Technology Group Limited 2022 All rights reserved Guangdong ICP No. 09156180


